Viewing the details of a managed server
You can view detailed information about the managed servers from Lenovo XClarity Administrator, including the firmware levels, server name, and universally unique identifier (UUID).
About this task
CPU usage is a measurement of the aggregated C-state residency. It is measured as a percentage of the used and maximum C0 residency, per second.
Memory usage is a measurement of the aggregated read/write volumes of all memory channels. This is calculated as a percentage of the used and maximum memory bandwidth that is available, per second.
The system-level air temperature is measured by a physical sensor at the front of the server. This temperature represents inlet air temperature for the server. Note that the air temperature that is reported by XClarity Administrator and the CMM might differ if the temperature is captured at different points in time.
Procedure
Complete the following steps to view the details for a managed server.
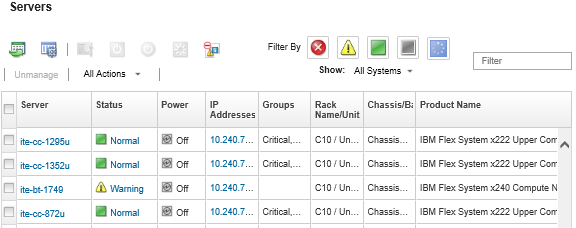
- From the XClarity Administrator menu bar, click . The Servers page is displayed with a tabular view of all managed servers (rack servers and compute nodes).
You can sort the table columns to make it easier to find the specific servers. In addition, you can select a system type from the All Systems drop-down list and enter text (such as a system name or IP address) in the Filter field to further filter the servers that are displayed.
- Click the link for the server in the Server column. The status summary page for that server is displayed, showing the server properties and a list of components that are installed in that server.
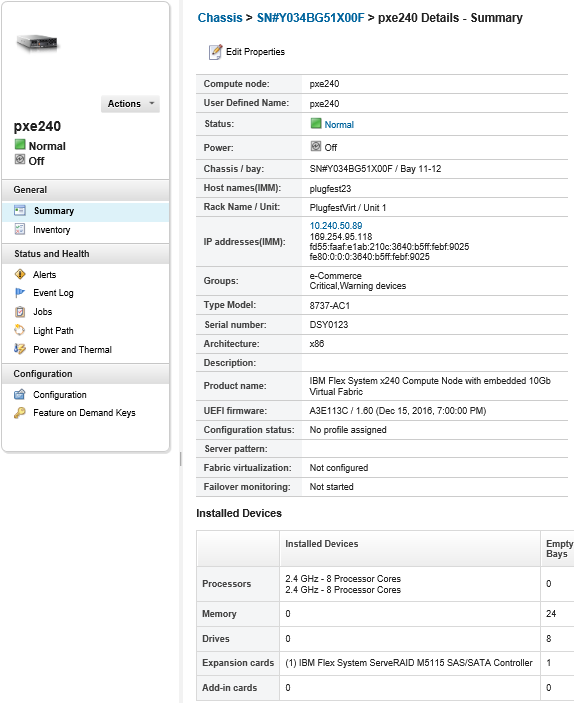 NoteFor System x and NeXtScale servers, the LAN over USB address is listed on this page; however, you cannot change that address from the
XClarity Administrator. Instead, you must use the baseboard-management-controller interface for the server. For more information, see Accessing the IMM2 using the LAN over USB interface
in the product documentation for the server. You can find the product documentation for your server in theBladeCenter online documentation.
After you finish
- View the rack or chassis that is associated with the server by clicking rack or chassis name from the Summary page.
- View a selected server in graphical rack or chassis view clicking or .
- Launch the management controller web interface for a selected server by clicking the IP address link (see Launching the management controller interface for a server).
- Remotely access a server (see Using remote control to manage Converged, Flex System, NeXtScale, and System x servers).
- Power a selected server on and off (see Powering on and off a server).
- Modify system information of a selected server by clicking Edit Properties.
- Refresh inventory of a selected server by clicking .
- Export detailed information about the servers to a CSV file clicking the .Note
For more information about inventory data in the CSV file, see the GET /nodes/<UUID_list> REST API.
When importing a CSV file into Microsoft Excel, Excel treats text values that contain only numbers as numeric values (for example, for UUIDs). Format each cell as text to correct this error.
Exclude events that are of no interest to you from all pages on which events are displayed by clicking the (see Excluding events).
Restart a selected server using a non-maskable interrupt (NMI) by clicking
- Change the Location LED state on a selected server to on, off, or blinking by clicking , selecting the state, and clicking Apply.Note
Toggling the Location LED for ThinkSystem SR635 and SR655 servers is not supported.
The Location LED on ThinkServer servers can be on or off. Blinking is not supported.
Disable or enable single sign-on for a selected ThinkSystem and ThinkAgile server by clicking or .
Single sign-on allows a user that is already logged in to XClarity Administrator to automatically log in to the baseboard management control. Single sign-on is enabled by default when a ThinkSystem or ThinkAgile server is brought into management by XClarity Administrator (unless the server is managed with CyberArk passwords). You can configure the global setting to enable or disable single sign-on for all managed ThinkSystem and ThinkAgile servers. Enabling single sign-on for a specific ThinkSystem and ThinkAgile server overrides the global setting for all ThinkSystem and ThinkAgile servers.
NoteSingle sign-on is disabled automatically when using the CyberArk identity-management system for authentication.- Enable or disable firewall rule changes on a selected server that limit incoming requests only from XClarity Administrator by clicking or .
The global encapsulation setting is disabled by default. When disabled, the device encapsulation mode is set to
normal
and the firewall rules are not changed as part of the management process.When the global encapsulation setting is enabled and the device supports encapsulation, XClarity Administrator communicates with the device during the management process to change the device encapsulation mode to
encapsulationLite
and to change the firewall rules on the device to limit incoming requests to those only from XClarity Administrator.AttentionIf encapsulation is enabled andXClarity Administrator becomes unavailable before a device is unmanaged, necessary steps must be taken to disable encapsulation to establish communication with the device. For recovery procedures, see lenovoMgrAlert.mib file and Recovering management with a CMM after a management server failure. - (non-ThinkServer servers only) Resolve issues that might arise between the Lenovo XClarity Administrator security certificate and the security certificate of the management controller in the selected server by clicking (see Resolving an untrusted server certificate).