Use the following diagnostic procedure to identify and solve problems that might occur in a managed environment.
Procedure
- Log in to the Operations Manager console.
- Click Monitoring.
- To view the status of all of your managed systems that have Windows operating systems installed, click .
- Check the health of the systems displayed in the top results pane.
All newly discovered objects are in a healthy state by default. The Health check monitoring task updates the status of an object at regular intervals, according to the default interval setting. You can configure the monitoring frequency by using the override-controlled parameters. For more information about the override-controlled parameter, refer to Microsoft System Center Operations Manager documentation.
- Select a system that shows a Critical or Warning state.
- Determine whether the error is related to the hardware or software.
Hardware-related failures: Check the Lenovo Hardware Components of the All Windows on Lenovo server Group pane to select the system. Scroll to the right to view all of the component status and data. You can personalize this view.
This pane contains state views based on the class of the hardware component basis. The purpose of this view is to provide access to detailed properties of each component instance. Look for additional system information in the Detail View pane.
Software-related failures: Check the Windows Computer in the All Windows on Lenovo server Group pane. This pane contains state views and information on a per-software-component-class basis. Select a system that has either a Critical or Warning health state.
The purpose of these views is to provide access to detailed properties of each component instance. The Detail View shows all instances of the system software with a health state for each of the four health aspects.
- To obtain more information and details about a failure, access the hardware information of the desired BladeCenter module or hardware system component by clicking BladeCenter Chassis and Modules.
- Optional: If you already know that a power supply component failed, for example, select the related view, Lenovo BladeCenter Power Modules, to determine the problem with the power supply.
- Click a Critical power module and review its related data.
- Review the information and data presented in the Detail View pane. Check all instances of the module type and each of its four health aspects.
- Right-click the selected module, and click .
- Select the alert, and look at the information on the State Change Events page.
- Depending on the type of alert you have, you can click View Alert for more information.
- Click the Knowledge tab to read the Knowledge page and one or more Knowledge Articles that relate to your alert.
In addition to the health information available for each object, related information might be available from other objects that are health-related from different perspectives. For example, a blade server that is monitored in-band through its platform agent shows a health state, but the BladeCenter chassis management module also shows a health state for the blade server.
Other BladeCenter chassis modules might affect the blade server health, such as a power supply that provides power to the blade server. Similarly, the health of a blade server from the management module perspective might include the health and other information about the operating system running on the blade server.
For instance, the following BladeCenter simple network management protocol (SNMP) alert has an event description field of 1.3.6.1.4.1.2.6.158.3.1.1.8 and an event ID of 1.3.6.1.4.1.2.6.158.3.1.1.14. Convert the decimal event ID value to a hexadecimal number to look up the message in the Advanced Management Module Message Guide.
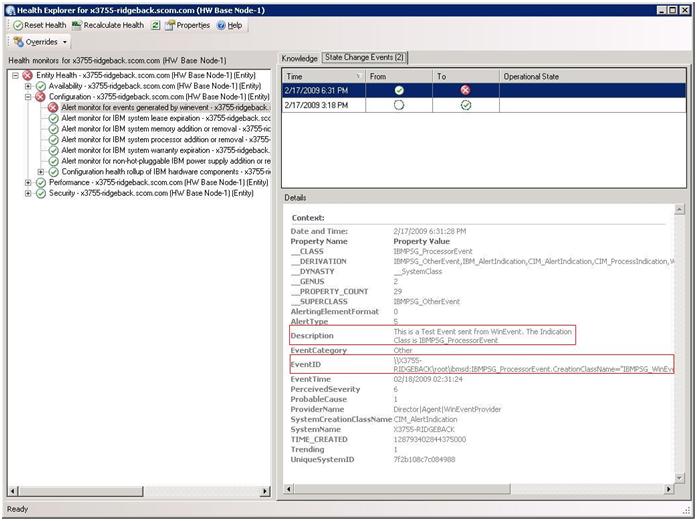
Figure 1. System x Windows Management Instrumentation (WMI) event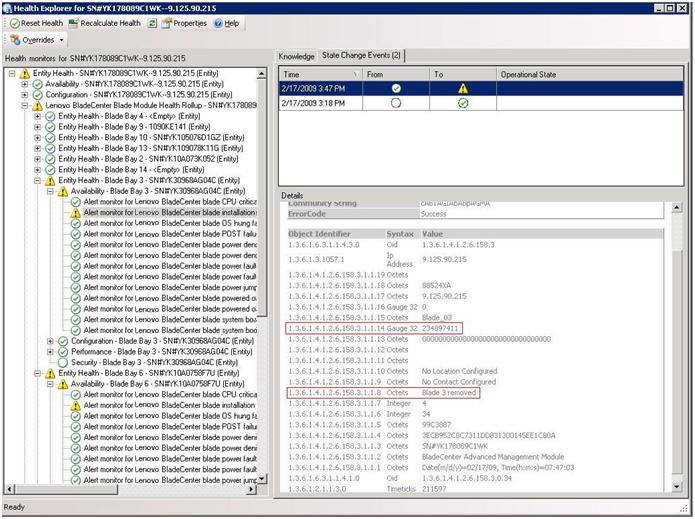
For a
System x WMI event, the
Details pane includes the event ID and a description.
Figure 2. Example of the State Change Events tab detail information