Viewing infrastructure resources status and details
You can view status and detailed information for datacenter infrastructure resources (such as PDUs and UPSs) that are managed through a Schneider Electric EcoStruxure IT Expert resource manager.
Before you begin
The Status column identifies the overall health of an infrastructure resource. The following health states are used. If an infrastructure resources is in an unhealthy state, use the alerts log to help identify and resolve the issues (see Monitoring active alerts).
- (
 ) Normal
 - (
 ) Warning
 - (
 ) Critical
Procedure
- Status for a specific infrastructure resource
To view the status of infrastructure resources, click Resources (
 ) > Infrastructure from the XClarity Orchestrator menu bar to display the Infrastructure card. If an infrastructure resource is in an unhealthy state, use the alerts log to help identify and resolve the issues (see Monitoring active alerts).
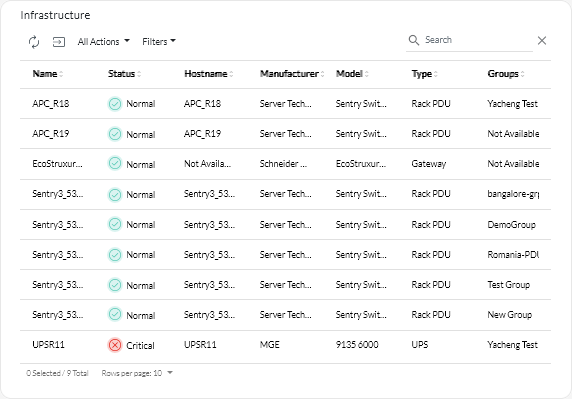
- Details for a specific infrastructure resource
- From the XClarity Orchestrator menu bar, click Resources () > Infrastructure to display the Infrastructure card.
- Click the row for the infrastructure resource to display the summary card for that resource.
- Complete one or more of the following actions.
- Click Summary to view an overall summary of the resource, including device information, and status.
- Click Alerts Log to display the list of active alerts and alert statistics for the resource (see Monitoring active alerts).
- Click Events Log to display the list of events for the resource (see Monitoring events).
- Click Sensors to display the list of sensors in the resource. You can determine the latest measurement of sensor from the Sensors card, or you can select one or more sensors and then click the Graph icon (
 ) to view line graphs over time for each selected sensor. Sensors with the same unit (such as watts or amps) are plotted on the same graph.NoteSchneider Electric EcoStruxure IT Expert collects sensor data every 5 minutes, and
XClarity Orchestrator synchronizes this data every hour. Currently, XClarity Orchestrator saves only the last 60 minutes of data.
- From the XClarity Orchestrator menu bar, click Resources (
After you finish
In addition to displaying summary and detailed information about an infrastructure resource, you can perform the following actions from this page.
- Launch the web interface for certain infrastructure resources from the Summary tab by clicking the IP address for the resource.