Monitoring trends in provisioning status
Lenovo XClarity Administrator regularly collects provisioning status, including compliance and active jobs for firmware updates and configuration patterns, for all managed devices so that you can monitor trends over a period of time.
About this task
You must have lxc_admin or lxc-supervisor authority to view trend data.
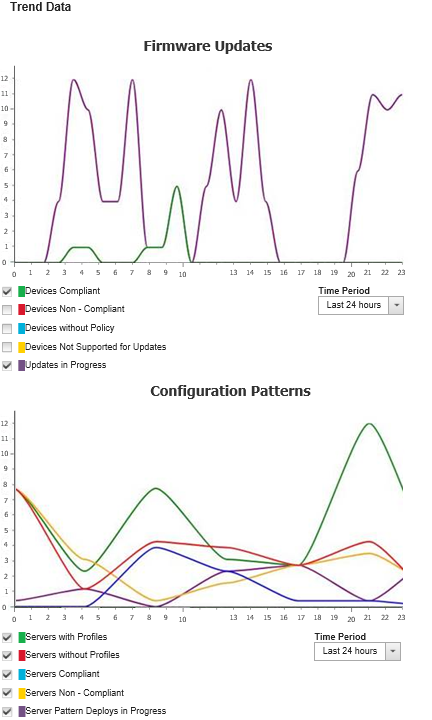
Firmware updates
Devices compliant. Number of devices that are compliant with their assigned firmware-compliance policy
Devices non-compliant. Number of devices that are not compliant with their assigned firmware-compliance policy
Devices without policies. Number of devices that do not have an assigned firmware-compliance policy
Devices not supported for updates. Number of devices for which firmware updates are not supported
Updates in progress. Number of devices for which firmware updates are in progress
Configuration patterns
Servers with profiles. Number of devices that have an assigned server profile
Servers without profiles. Number of devices that do not have an assigned server profile
Servers compliant. Number of devices that are compliant with their assigned server profile
Servers non-compliant. Number of devices that are not compliant with their assigned server profile
Server patterns in progress. Number of devices for which configuration-pattern updates are in progress
Procedure
Complete the following steps to view trends in provisioning status.
- Select the time period that you want to view.
24 hours. Displays data for the last 24 hours. Each data point is an average over a 1-hour period.
1 month. Displays data for the last 30 days. Each data point is an average over a 24-hour period.
The trend data is shown as a graph over the selected time period.