Viewing active alerts
You can view a list of all active hardware and management alerts.
About this task
Procedure
Complete one of these procedures to view the active alerts.
- To view only alerts for managed devices (known as hardware alerts):
From the XClarity Administrator title bar, click the Status pull-down to display a summary of hardware and management alerts.
- Click the With Hardware Alerts tab to see a summary of alerts for each managed device.
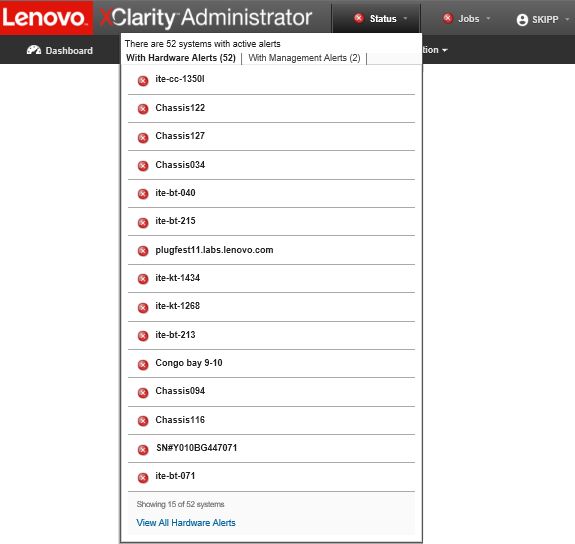
Hover the cursor over a device that is listed under that tab to display a list of alerts for that device.
Click the All Hardware Alerts link to display the Alerts page with a filtered list of all hardware alerts.
To view only alerts from XClarity Administrator (known as management alerts):
From the XClarity Administrator title bar, click the Status pull-down to display a summary of hardware and management alerts.
- Click the With Management Alerts tab to see a summary of all CMM and XClarity Administrator alerts.
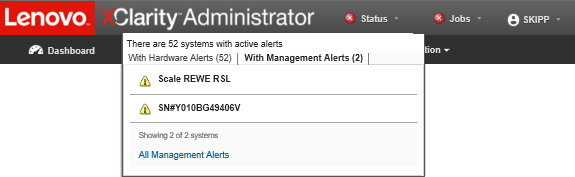
Hover the cursor over a device that is listed under that tab to display a list of alerts for that device.
Click the All Management Alerts link to display the Alerts page with a filtered list of all CMM and XClarity Administrator alerts.
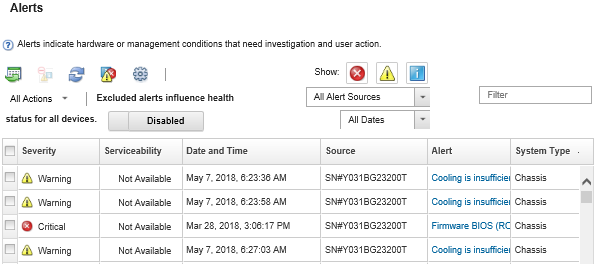
To view all alerts in XClarity Administrator, click from the XClarity Administrator menu bar. The Alerts page is displayed with a list of all active alerts.
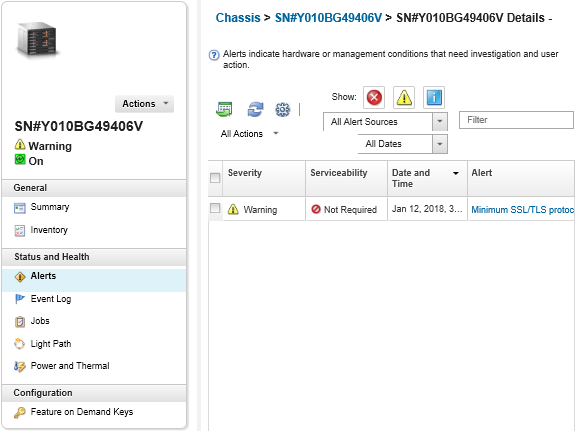
To view alerts for a specific device:
From the XClarity Administrator menu bar, click Hardware, and then click a device type. A page is displayed with a tabular view of all managed devices of that type. For example, click to display the Servers page.
Click a specific device to display the Summary page for the device.
Under Status and Health, click Alerts to display a list of all alerts associated with that device.
NoteThe Serviceability column might show
Not Available
if:The alert on the device occurred before XClarity Administrator started managing it
The event log has wrapped, and the event associated with that alert is no longer in the event log.
Results
- Refresh the list of alerts by clicking the Refresh icon (
 ).TipIf new alerts are detected, the alerts log refreshes automatically every 30 seconds.
 - View information about a specific alert (including an explanation and user action) and about the device that is the source of the alert (such as the Universally Unique Identifier) by clicking the link in the Alert column. A dialog with information about the alert properties and details is displayed.NoteIf the explanation and recovery actions for an alert are not displayed under the
Details tab, go to Lenovo Flex System online documentation, and search for the alert ID (for example, FQXHMSE0004G). The website always provides the most up-to-date information. - By default, excluded alerts do not influence the health status of managed devices. You can allow excluded alerts to influence the health status of managed devices from the Alerts page by clicking the toggle to enable Excluded alerts influence health status for all devices.
- You can set threshold preferences for raising an alert and event when a certain value, such as the life of an SSD in a ThinkSystem or ThinkServer server, exceeds a warning or critical level (see Setting threshold preferences for generating alerts and events).
- Export the alerts log by clicking the Export as CSV icon (
 ).NoteThe timestamps in the exported log use the local time that is specified by the web browser.
 - Exclude specific alerts from all pages on which alerts are displayed (see Excluding alerts).
- Narrow the list of alerts that are displayed on the current page:
- Show or hide alerts of a specific severity by clicking the following icons:
- Critical alerts icon (
 )
) - Warning alerts icon (
 )
) - Informational alerts icon (
 )
)
- Critical alerts icon (
- Show only alerts from specific sources. You can choose one of the following options from the drop-down list:
- All Alert Sources
- Hardware Events
- Management Events
- Service Center Events
- Customer Serviceable Events
- Non-serviceable Events
- Show only alerts with a specific date and time. You can choose one of the following options from the drop-down list:
- All Dates
- Previous two hours
- Previous 24 hours
- Past Week
- Past Month
- List only alerts that contain specific text by entering the text in the Filter field.
- Sort the alerts by column by clicking a column heading.
- Show or hide alerts of a specific severity by clicking the following icons: