Viewing a summary of your hardware status
The Hardware Status area displays the status of all managed devices.
Procedure
To obtain more information about all of the devices of that type, click the number listed under the device type.
To view more information about only those devices of that type and status, click the icon or number beside each status icon.
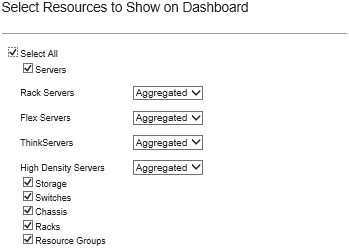
Servers. Displays the total number of servers (compute nodes, rack servers, and tower servers) that XClarity Administrator manages, and the number of servers with normal, warning, and critical status. For more information, see Viewing the status of a managed server.
Storage. Displays the total number of storage devices that XClarity Administrator manages, and the number of storage devices with normal, warning, and critical status. For more information, see Viewing the status of storage devices.
Switches. Displays the total number of RackSwitch and Flex System switches that XClarity Administrator manages, and the number of switches with normal, warning, and critical status. For more information, see Viewing the status of switches
Chassis. Displays the total number of Flex chassis that XClarity Administrator manages, and the number of Flex chassis with normal, warning, and critical status. For more information, see Viewing the status of a managed chassis.
Racks. Displays the number of racks that are created in XClarity Administrator, and the number of racks with devices that have the normal, warning, and critical as their highest status. For more information, see Viewing the status of devices in a rack.
Resource groups. Displays the number of resource groups that XClarity Administrator manages and the number of resource groups with devices that have the normal, warning, and critical as their highest status. For more information, see Viewing the status of devices in a resource group.
