Lenovo XClarity Orchestrator raises alerts based on known hardware and firmware issues. You can define custom alert rules to raise analytics alerts when a specific event occurs or when a specific metric is breached. Then, you can use those alerts to generate custom analytics reports (queries).
About this task
Events are raised for all alerts, including custom analytics alerts. The same event code is used for both the active alert and the event using the format FQXXOCAxxxxc, where xxxx is the unique identifier and c is the severity (see Events and alerts from XClarity Orchestrator).
Custom alerts are included in the list of active alerts for health status. All active alerts, including custom alerts, and are displayed in a single, unified view (see Monitoring active alerts).
Procedure
To create a custom alert rule, complete the following steps.
- From the XClarity Orchestrator menu bar, click , to display the Custom Alert Rules card.
- Click the Create icon (
 ) to display the Create Custom Alert Rule dialog.
 - Specify a unique name and an optional description for the custom alert.
- Select the source type for this rule.
- Event. Raises an alert when a specific event occurs, based on the rule criteria.
- Metric. Raises an alert when a specific metric is breached, based on the rule criteria.
- Click Rule Trigger Details, and specify the criteria for this rule. The criteria varies depending on the source type.
- Event-based alerts rules
- Specify the target type for this alert.
- Device. Raises an alert when the event occurs on any device. The device name is included in this alert.
- Device group. Raises an alert when the event occurs on a device in any device group. The group name is included in the alert.
- Specify the ID of the event that triggers an alert. For a list of event IDs, see Event and alert messages.
- Specify the number of times (count) that the event must occur in the specified interval before an alert is raised.
- Select the period of time (interval), in minutes, in which the event occurs before an alert is raised.
- Metric-based alerts rules
- Select the criteria mode.
average. Raises an alert when the average value of the metric breaches the threshold (based on the comparator) during a specific interval.
For example, you can create a rule to raise an alert when the average CPU Temperature (metric) during a 24-hour period (interval) is greater than (operator) 40 degrees C (threshold).
count. Raises an alert when the metric breaches the threshold (based on the comparator) a certain number of times during a specific interval.
For example, you can create a rule to raise an alert when the CPU Temperature (metric) is greater than (operator) 40 degrees C (threshold) for 5 times (count) in a 24-hour period (interval).
simple. Raises an alert when the metric breaches the threshold (based on the comparator).
For example, you can create a rule to raise an alert when the CPU Temperature (metric) is greater than (operator) 40 degrees C (threshold).
- Select the measurement (metric) for this alert from a list of measurements that are supported for the managed resources.
- If the criteria mode is “count,” specify the number of times that the value is breached in the specified interval before an alert is raised.
- Select the comparison function.
- >=. Greater than or equal to
- <=. Less than or equal to
- >. Greater than
- <. Less than
- =. Equal to
- !=. Not equal to
- Specify the threshold value to compare to the metric value.
- If the criteria mode is “average” or “count,” select the period of time (interval), in minutes, in which the metric is evaluated.
- Click Alert and Event Details, and specify the information to display for the alert and event.
- Specify the message, description, and user action to display for the associated alert and event. You can include variables by enclosing the field (variable) name in double brackets, for example, [[DeviceName]]. A list of available fields (based on the selected measurement) is displayed in the table to the right of the input fields.
- Select the severity for this alert rule.
- Warning. User can decide if action is needed.
- Critical. Action is needed immediately, and the scope is broad (perhaps an imminent outage to a critical resource will result).
- Specify a unique 4-digit number to use as the event code for this alert. You can specify a number from 0001 – 9999 that is not already used.
- Optionally change the status to Enabled to enable XClarity Orchestrator to raise an analytics alert when the criteria for the custom alert is met.
- Click Create.
After you finish
You can view the list of analytics alerts that were raised based on the enabled custom alert rules by clicking .
 ) > Custom Alerts, to display the Custom Alert Rules card.
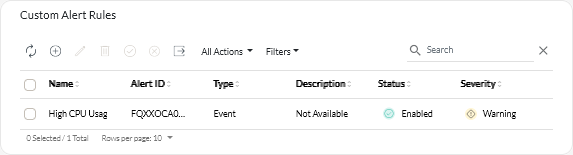
 ).
). ).
). ) or Disable icon (
 ).
).