Viewing devices status
You can view the status of all devices that are managed across all resource managers.
Procedure
- Status summary of all devices
From the XClarity Orchestrator menu bar, click Dashboard (
 ) to display the dashboard cards with an overview and status of all managed devices and other resources (see Viewing a summary of your environment).
You can change the scope of the summary to only those devices that are managed by a specific resource manager or in a specific resource group by using the Select manager drop-down menu.
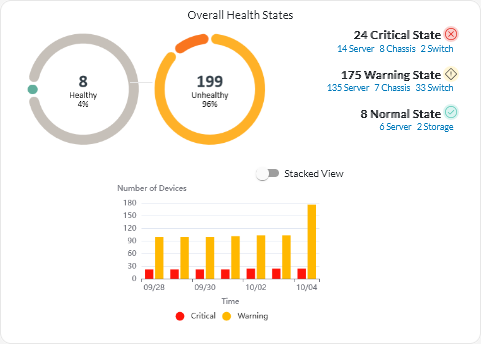
Each colored bar in the circular and bar graphs indicates the number of devices in a specific state. You can hover over each colored bar to get more information about the state. You can also click the number of devices in each state to view a list of all devices that fit the criteria.
- Status for all devices of a specific type
To view the overall active alert summaries, click Resources (
 ) from the XClarity Orchestrator menu bar, and then click the device type to display a card with a tabular view of all devices of that type. For example, if you select Severs, a list of all rack, tower, and dense servers and all Flex System and ThinkSystem servers in a chassis is displayed.You can change the scope of the summary based on device property from the Analyze by drop-down list.
- Machine Type Model. (default) This report summarizes device health by machine type model (MTM).
- Machine Type. This report summarizes device health by machine type.
- Product Name. This report summarizes device health by product.
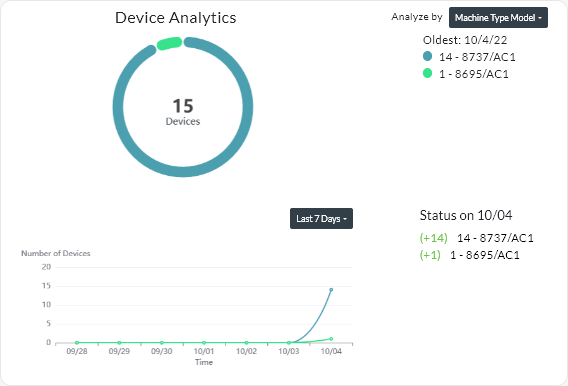 XClarity Orchestrator summarizes device health based on specific criteria. Each summary includes the following information.
- A circular chart that shows the total number of devices that are unhealthy and percentage of devices in each unhealthy state (critical, warning, and unknown).TipEach colored bar in the circular graph indicates the number of devices in a specific state. You can hover over each colored bar to get more information about the state.
- A line graph that shows number of devices in each health state per day over the specified number of days.TipEach colored bar in the line graph indicates the number of devices in a specific state. You can hover over each colored bar to get more information about the state.
- The number of devices of each type that are unhealthy on a specific day. The current day is shown by default. You can change the day by hovering over each day in the line graph.
- Status for a specific device
From the XClarity Orchestrator menu bar, click Resources (
), and then click the device type to display a card with a tabular view of all devices of that type. For example, if you select Severs, a list of all rack, tower, and dense servers and all Flex System and ThinkSystem servers in a chassis is displayed.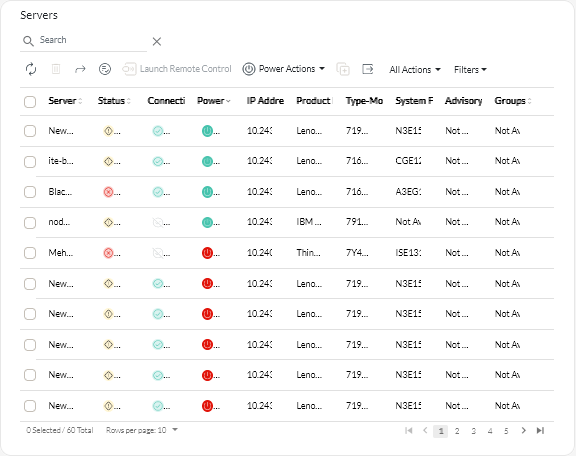
The Status column identifies the overall health of a device. The following health states are used. If a device is in an unhealthy state, use the alerts log to help identify and resolve the issues (see Monitoring active alerts).
- (
 ) Normal
 - (
 ) Warning
 - (
 ) Critical
The Connectivity column identifies the connection status between the device and XClarity Orchestrator. The following connectivity states are used.- (
 ) Offline
 - () Offline Managed
- (
 ) Online
 - (
 ) Partial
 - (
 ) Pending
The Power column identifies the power status. The following power states are used.- (
 ) On
) On - (
 ) Off
) Off
The Advisory column identifies the number of online customer advisories (technical tips) that are related to each server. Click the number to display the Advisory card on the device details page to display a list of online customer advisories, including the abstract and link for each advisory. Click a link to open a webpage with details for that advisory.
- (
After you finish
- Add a selected device to a group by clicking .
- Forward reports about specific device types on a reoccurring basis to one or more email addresses by clicking the Create Report Forwarder icon (
 ). The report is sent using the data filters that are currently applied to the table. All shown and hidden table columns are included in the report. For more information, see Forwarding reports.
 - Add a report about a specific device type to a specific report forwarder using the data filters that are currently applied to the table by clicking the Add to Report Forwarder icon (
 . If the report forwarder already includes a report for that device type, the report is updated to use the current data filters.