Viewing a summary of your environment
The dashboard is the hub of Lenovo XClarity Orchestrator, which provides access to information that is important to you. It contains report cards that each summarize the status of resources and activities in your environment, including devices health, compliance, and alerts.
To access the dashboard, click Dashboard (![]() ) from the XClarity Orchestrator menu bar.
) from the XClarity Orchestrator menu bar.
You can change the scope of the summary to only those devices that are managed by a specific resource manager or in a specific resource group by using the Select manager drop-down menu.
You can click any of the linked statistics on the Dashboard to view a filtered list of data that fits the criteria.
Warranty
The Warranty card summarizes the warranty period for managed devices, including the following data.
- Number of devices for which the warranty is expired
- Number of devices for which the warranty is active
- Number of devices for which warranty data is not available
Service tickets
The Service Tickets card summarizes the managed, including the following data.
- Total number of active service tickets
- Number of service tickets that are open
- Number of service tickets that are in progress
- Number of service tickets that are on hold
- Number of service tickets that are closed
- Number of service tickets in other states
Firmware compliance
The Firmware Compliance card summarizes compliance with the firmware-compliance policy assigned to managed devices in XClarity Orchestrator, including the following data.
- Number of devices that are not compliant
- Number of devices that are compliant
- Number of devices that do not have an assigned firmware-compliance policy
- Number of devices for which compliance is not supported
- Number of devices for which compliance is being checked against the assigned policy
Configuration compliance
The Configuration Compliance card summarizes compliance with the server-configuration patterns on managed devices, including the following data.
- Number of devices that are not compliant with their assigned pattern
- Number of devices that are compliant with their assigned pattern
- Number of devices that do not have an assigned pattern
- Number of devices for which a configuration-compliance check is in progress
- Number of devices for which a manual restart is required to complete pattern deployment (pending restart)
- Number of devices for which the last pattern deployment failed
Security Fixes
The Security Fixes card summarizes the number of managed devices that have common vulnerabilities and exposures (CVEs) for which a security fix is available, by the highest CVE severity.
- Number of devices that have at least critical vulnerabilities
- Number of devices that have at least one or more high, medium, or low vulnerabilities but no critical vulnerabilities
- Number of devices that have no known vulnerabilities and are protected
Firmware age
The Firmware Age card summarizes the age of firmware per component type.
- Number of firmware that is more than 2 years old for each component type
- Number of firmware that is between 1 year and 2 years old for each component type
- Number of firmware that is between 6 months and 1 year old for each component type
- Number of firmware that is less than 6 months old for each component type
Overall health status
The Overall Health States card summarizes the managed devices that are currently healthy and unhealthy in your environment.
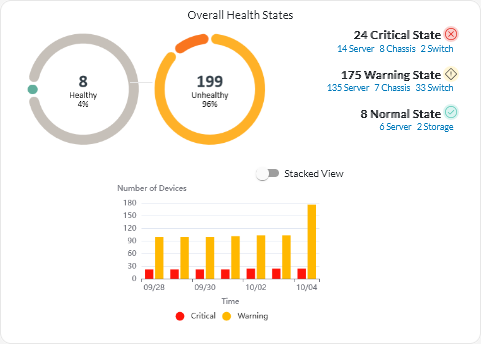
This card includes the following data.
A circular graph representing the percent of devices that are in a healthy state (normal) and unhealthy state (critical, warning, and unknown)
TipEach colored bar in the circular graph indicates the number of devices in a specific state. You can hover over each colored bar to get more information about the state.Total number and percent of devices that are healthy and unhealthy
Number of devices of each type that are currently in critical, warning, normal and unknown states
TipYou can click on the number of devices in a specific state to open a page with a filtered list of devices that match the criteria.A line graph representing the number of devices in unhealthy states, over time
TipEach colored bar in the bar graph indicates the number of devices in a specific state. You can hover over each colored bar to get more information about the state.
Active alerts
The Devices Active Alerts card summarizes the active alerts were raised by the managed devices.
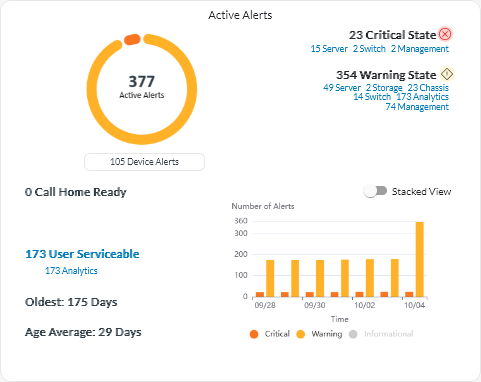
This card includes the following data.
A circular graph representing the percent of active alerts for each severity (critical, warning, informational, and unknown)
TipEach colored bar in the circular graph indicates the number of alerts with a specific severity. You can hover over each colored bar to get more information about the severity.Total number of active alerts
Number of devices that have active alerts
Total number of active alerts for each severity, and the number of devices of each type that have active alerts for each severity
TipYou can click on the number of devices in a specific state to open a page with a filtered list of devices that match the criteria.A line graph representing the number of devices in unhealthy states, over time
TipEach colored bar in the bar graph indicates the number of alerts with a specific severity. You can hover over each colored bar to get more information about the severity.Number of active alerts that opened a service ticket with the Lenovo Support Center (Call Home)
Total number of active alerts that require user action (user serviceable), and the number of number of devices of each type that have active user-serviceable alerts
Age of the oldest active alert
Average age of all active alerts